

Insouciance
If you follow us on LinkedIn, you will notice our desire to improve our vocabulary through the launch of the Auour Word of the Day (AWOTD). Within this note, you will see demonstrations of our fresh learnings. As with our last note, however, we are going to keep text to a minimum and not perorate (verb; to speak at great length)—oops, we just did.
We have repeatedly said we are concerned about the perceived insouciance (adjective; free of concern) of the investment community regarding valuation and growth forecasts. With both equity and fixed income markets priced to perfection, according to historical norms, and optimism in an unperturbed growth outlook, the strong momentum of world markets leaves us not in the carefree camp.
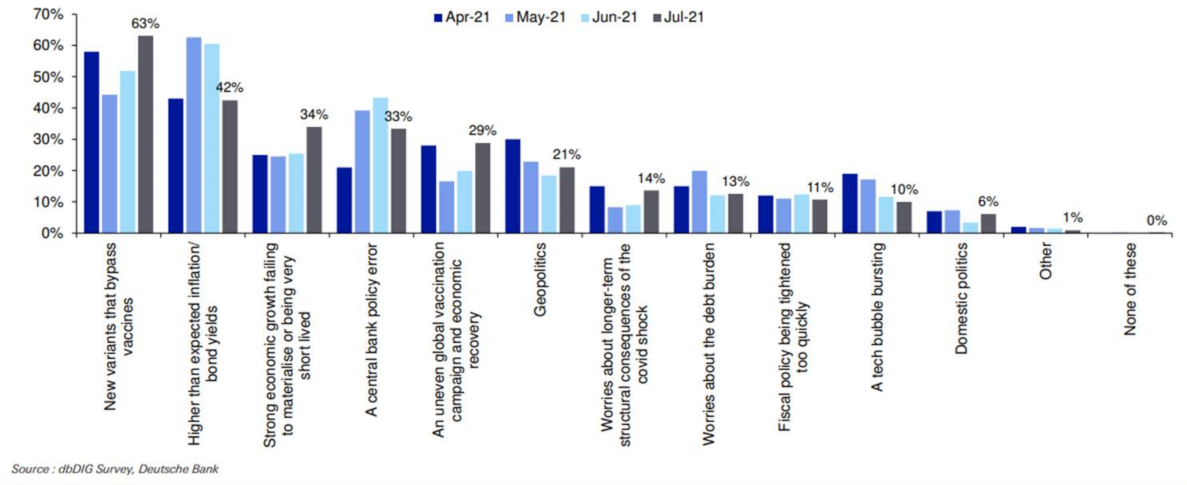 The research group of Deutsche Bank runs a monthly survey of institutional investors, gauging their top concerns. The chart below shows that inflation concerns were prominent in May and June as economies around the world re-opened and supply chains were struggling to keep up with demand. Increased caseloads from the delta-variant became everyone’s chief concern in July, however, as worries revived that we would need to revisit past pandemic protocols. (We hope not because our weight is only now moving back to pre-pandemic levels.)
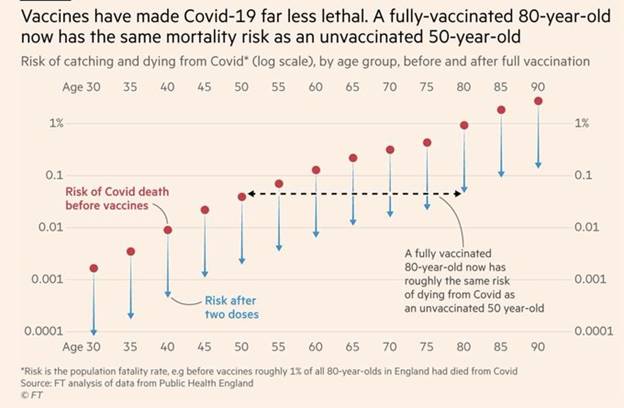
The delta variant appears to be more infectious than the 2020 variants with it too early to understand its severity, leading to concern that our economy’s re-opening process could slow or stall. Thankfully, the vaccines being used in the U.S. and Europe seem to maintain their effectiveness in the face of the delta variant. The chart below is a nice way of seeing just how protective these vaccines, with the risk of dying from Covid dropping by at least an order of magnitude once jabbed.
As vaccination rates among adults in most of the developed world reached well above 60%, perambulating (verb; to stroll) without concern was becoming increasingly prevalent. However, the delta variant’s spread has us checking ourselves. And a slowdown in the re-opening process might be a factor in recent drops in several types of financing activity, including credit impulse and corporate debt.
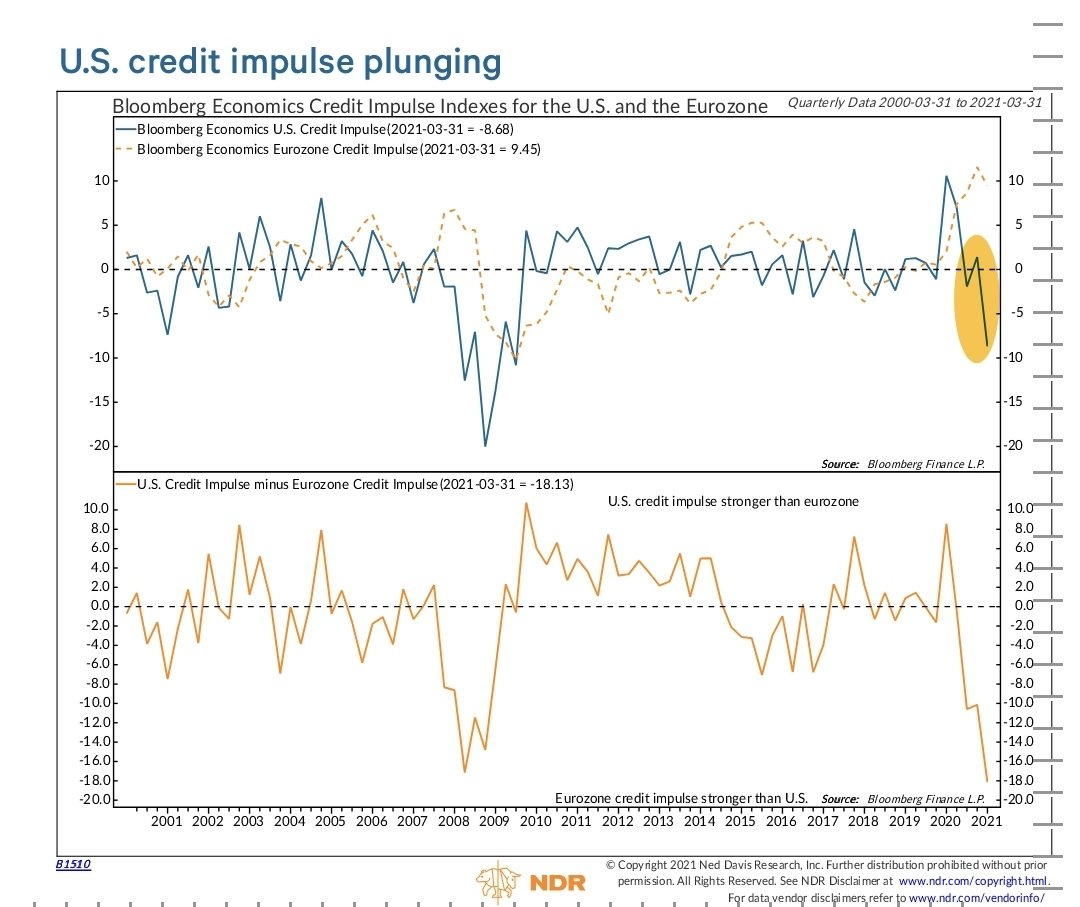
Credit impulse—a measure of financing activity relative to the size of the economy—is showing a worrisome deceleration. We have seen a significant reduction in financing activity in the U.S. and Europe and, most recently, in China. Some of it may be due to the reduction in fiscal stimulus, as well as supply chains getting back to normal. We are monitoring to see if the burst in economic activity is followed by a bust. 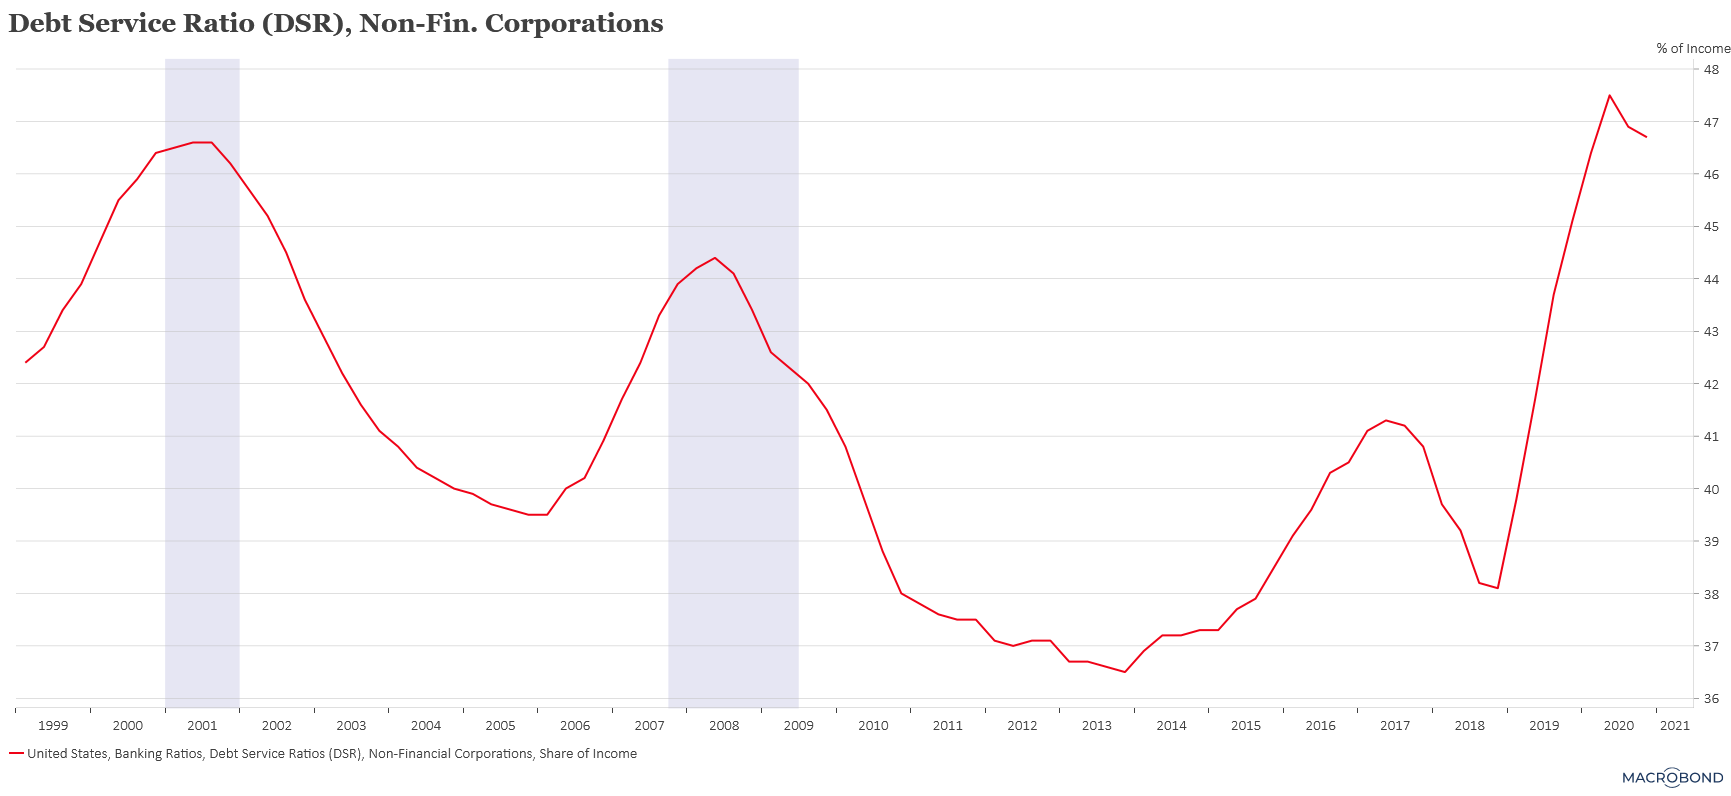 This fear has its roots in the high level of debt held at the corporate level. The record level of leverage in the corporate sector has increased the cost of servicing it even with interest rates being so low. The cost of debt is consuming almost 50% of corporate income. Another slowdown could be unpleasant for those already finding it hard to operate.
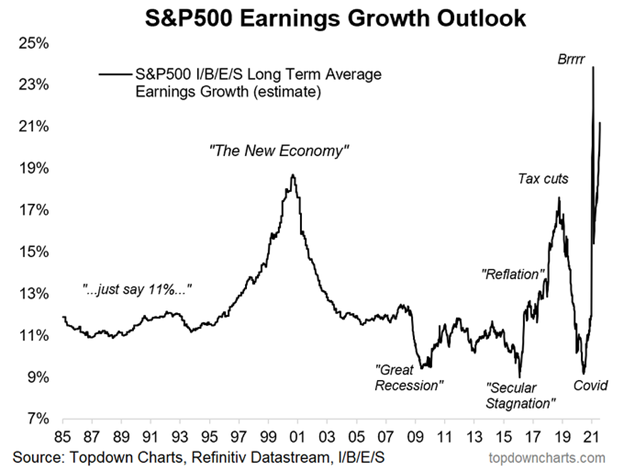 The concerns we at Auour have do not appear to be shared by others; analysts have shared very optimistic updates for the long-term growth of the firms they cover. In fact, the consensus estimate for the average growth of the S&P 500 aggregate earnings stands at over 20% (per year for the next five years). Keep in mind that history has not been kind to the average analyst’s forecasting ability, though. Their estimates track the strength of the equity market, as seen below, rather than predicting the future success of the firms.
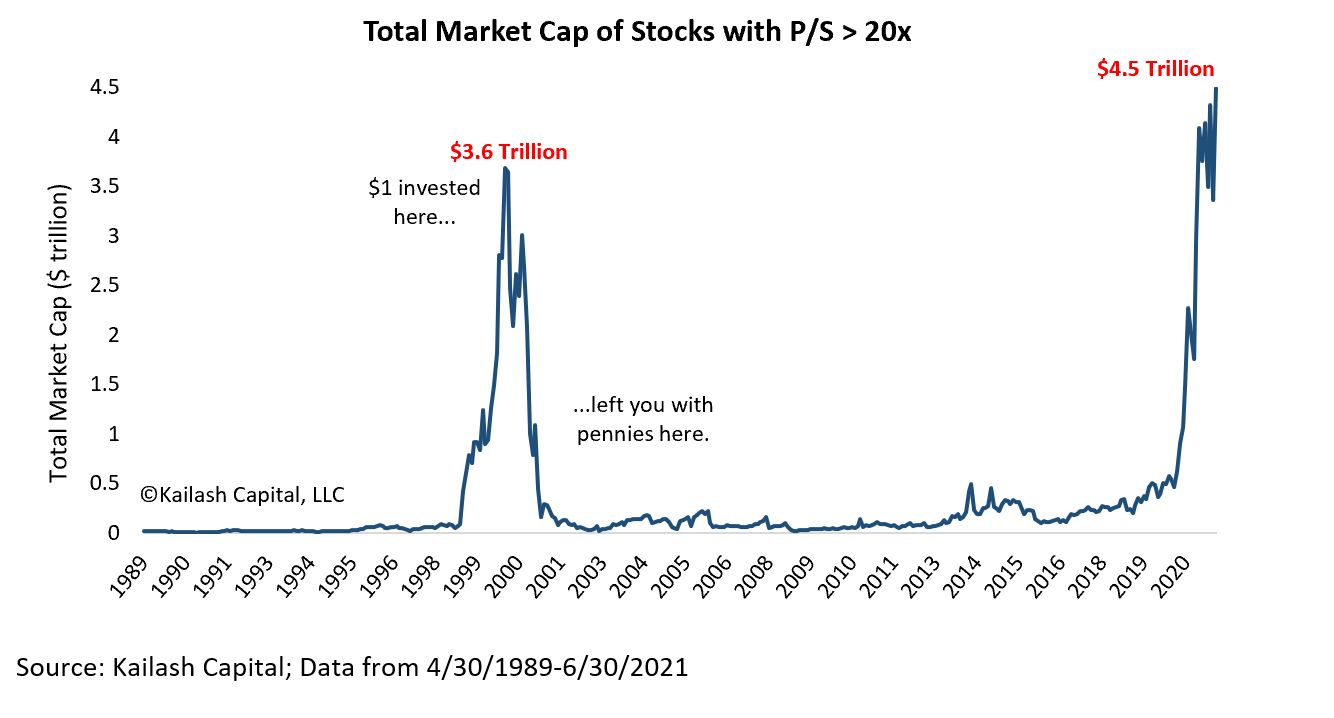 The ebullience (not an AWOTD, but it should be) of the analysts is one thing, but pricing investor optimism into the fastest growing companies is another. The next graph highlights the extreme optimism residing within the equity markets. It shows aggregate market value of the most expensive companies surpassing that seen during the dotcom period. The total value of those companies equals about $4.5 trillion, or 10% of the total value of the U.S. equity market.
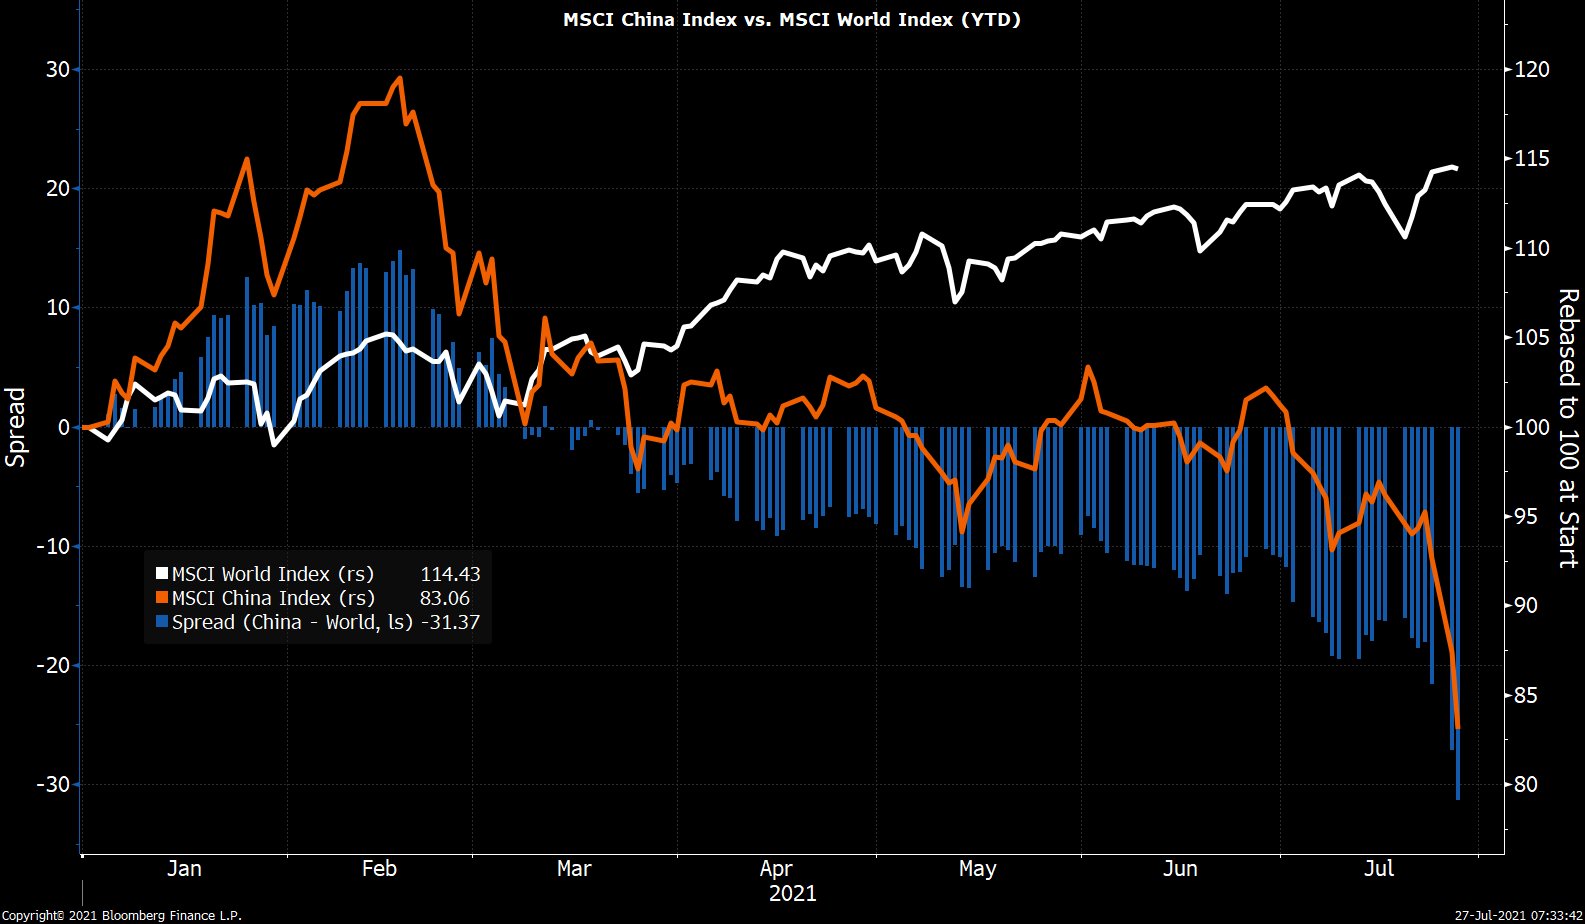 The level of optimism about the future growth of a new company, industry, or investment theme can turn into fear quickly. We are seeing that now in the Chinese equity markets, specifically the Chinese internet space. The chart below shows the dramatic underperformance of the overall Chinese equity markets relative to the global index (MSCI All Country World Index), with it underperforming by 30% since the start of the year.
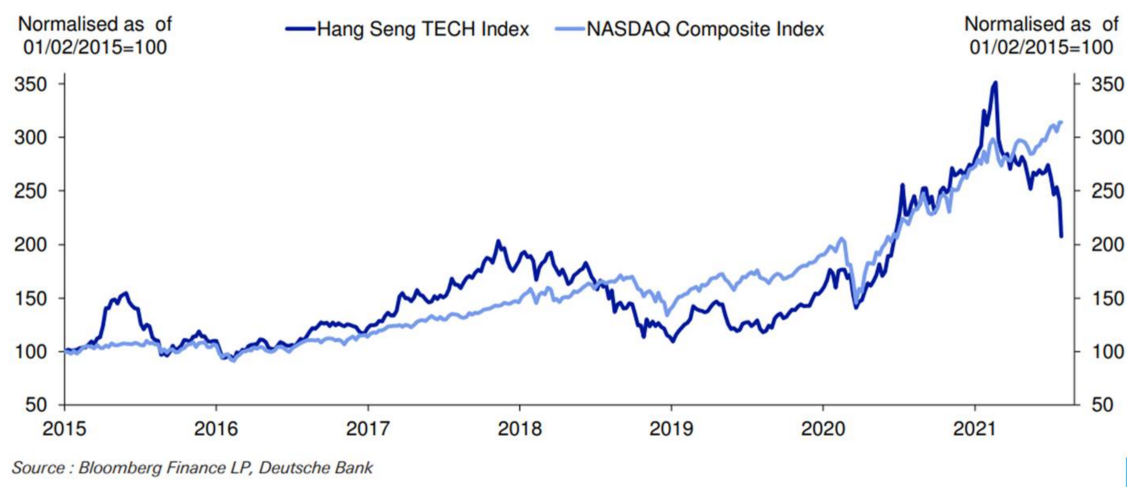 The slide in the Chinese stock market started in February of this year but has accelerated recently as the communist party considers turning the fast-growing online tutoring companies into non-profit entities—banning any for-profit operations. The communications out of the ruling party would suggest this is not furphy (noun; false report). China, for all the opportunities it offers as a market, continues to remind investors that companies exist at the pleasure of the communist party, not the other way around. The graph below highlights the magnitude of the drop within the Chinese technology space relative to their U.S.-domiciled brethren.
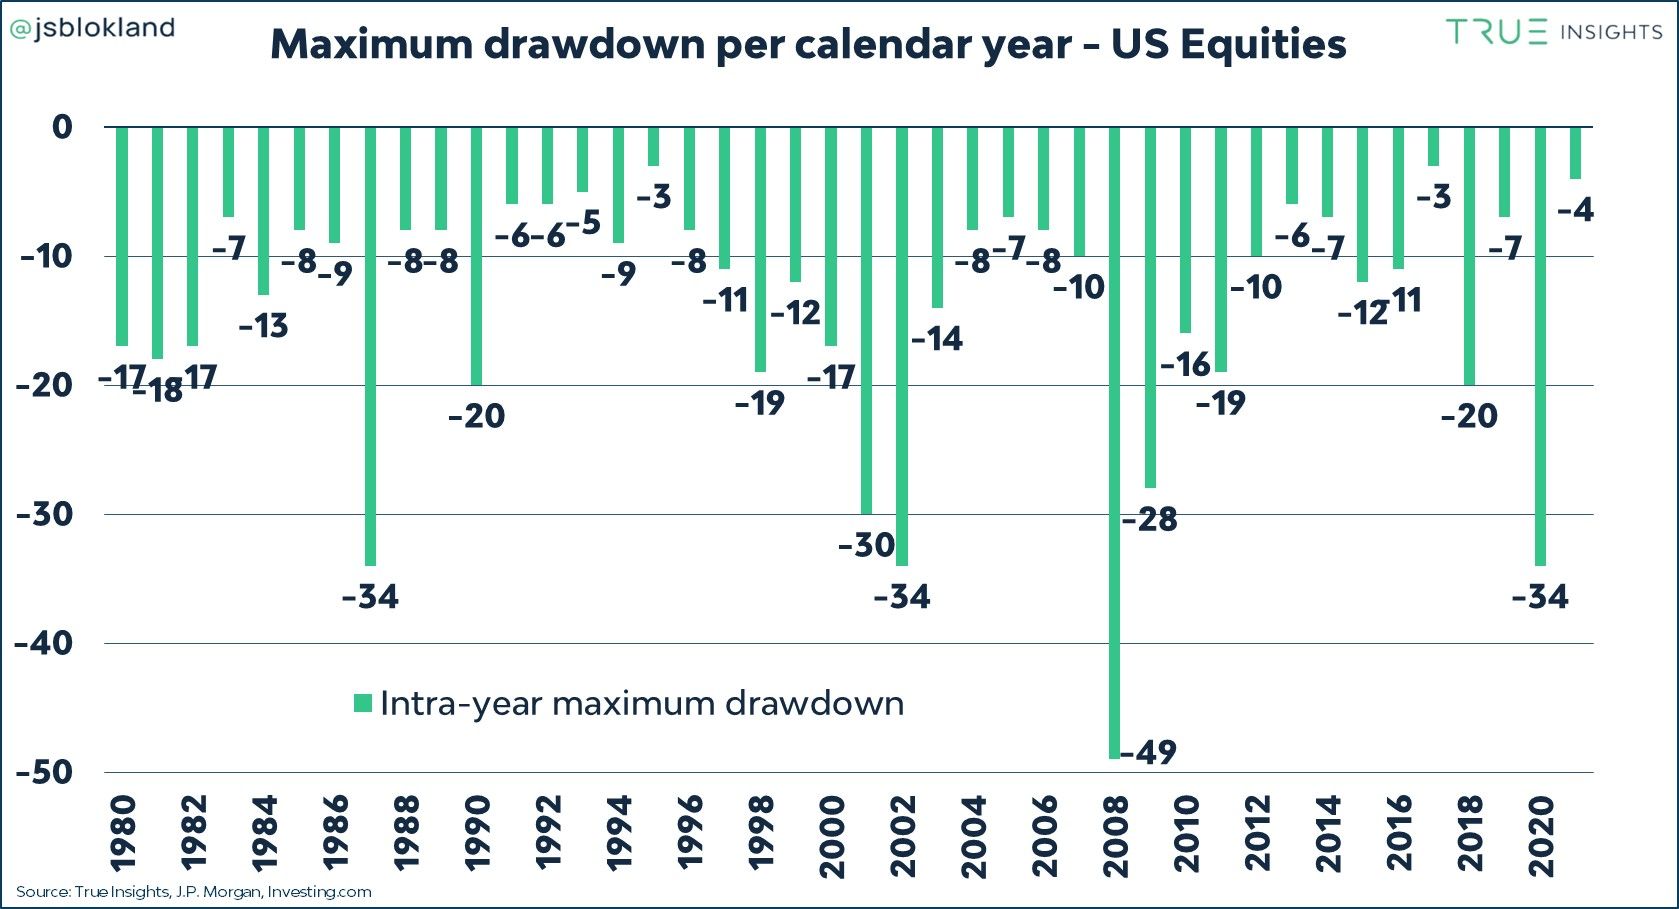 We will end with one last graph showing the maximum drop investors had experienced in each year going back to 1980. Last year was on a par with some of the worst. Will that be an isolated occurrence, or is it a sign of increased volatility within markets? We stay in the camp that believes we are going to experience higher levels of volatility, which argues for a strategy to dampen the volatility while we wait for better opportunity.