There comes a time when it is important to step back and take a deeper look at the fundamentals of a company or industry rather than just bask in the glow of its historical stock performance. For Utilities, now is that time. With the XLU nearing all time highs, holding near a 4% dividend yield, it would probably come as a surprise that utilities, as a whole, do not generate free cash flow, leaving many of them unable to support their dividends through their ongoing operations and increasing the risk they fall into a debt trap.
In the quest for current income, it has made sense to find those firms and industries that can provide a good and steady stream of dividends. For longer than the past decade, utilities have fit that need. However, they are approaching a point where the sustainability of those dividends is at risk. Using the XLU components (i.e. Duke (DUK), Southern Company (SO), Dominion (D), etc) as a foundation for this report, it becomes clear that what has worked for the past 10 years, may not work over the course of the next 10 years.
This note is by no means exhaustive. The intent is to start an ongoing dialogue around the lack of sustainability in the dividend policies of many within the sector.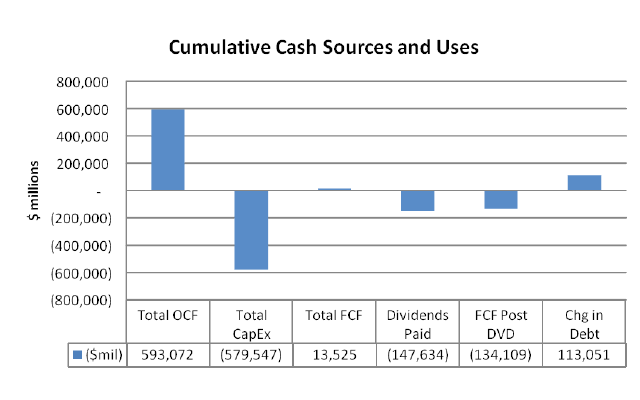
Figure 1: Cumulative Cash Sources and Uses (Bloomberg, CapitalIQ)
Figure 1 looks at the cumulative cash production, disbursement, and capital structure of the 31 companies that make up the XLU over the course of the past 12 years. Over the past 12 years, the utilities that make up the XLU have generated operating cash flow of approximately $593B and yet have had capital expenditures that nearly approach that same level ($580B). This has resulted in those 31 utilities generating a total of $13B in free cash flow, cumulatively, over that time period. That appears to be the extent of the good news.
The shock comes from the fact that they have paid out cumulative dividends of $147B over those same 12 years, more than 10x times the amount of excess cash they have generated. To fund this payout, they have taken on an additional $113B in debt.
With cash being king, the above data makes it hard to see how the industry can continue the current dividend policies. And the supporting data only reinforces the tenuous situation. In the table below, we look at the 10 year average of a few statistics for the top 10 members of the XLU. Over the course of the last decade, the top 10 had an average return on assets of 3.2%. This is 73% of the dividend yield and 67% the cost of their debt. With this data, it is difficult to understand how the returns to either the equity holders or the debt holders can be sustained. To add to the issues, at least for the equity holders, the payout ratio is uncomfortably high at 73%, almost 20% above its 10 year average.
|
Top 10 Utility Statistics |
|
| Return on Assets (10 year average) |
3.2% |
| Dividend Yield (10 year average) |
4.4% |
| Average Interest Rate on Debt |
4.8% |
| Dividend Payout Ratio (10 year average) |
61% |
| Dividend Payout Ratio (Current) |
73% |
Table 1: Top 10 Utility Statisitics (Bloomberg, CapitalIQ)
The case is not being made that the dividends are at risk of being cut in the short term (though they probably should in my modest opinion). The analysis being presented simply states that the current level of dividends can not go on indefinitely. And, as important, the current capital structures leave little room for error if the access to capital changes. With the most recent outflows from bond funds, one should be concerned that access to capital could change soon.
Breakdown of the Top 10
The intent of the report is to highlight the increasing risks within the industry. However, it is worth digging deeper into the individual companies within the industry as the outlook becomes even worse. Looking just at the top 10 utilities that make up almost 60% of the value of the XLU, we can see some interesting detail.
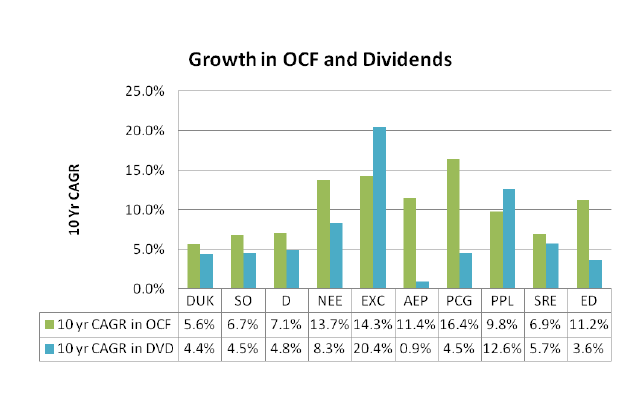
At first glance, the dividend growth experienced over the past 10 years does not look out of line with the growth in net operating cash flow (also known as Cash Flow from Operations). As shown, all but PPL and EXC have produced a growth in OCF above the growth in their dividends.
Figure 2: Growth in OCF and Dividends (Bloomberg, CapitalIQ)
However, that may create a false sense of security once the data is distilled down a little more. Cash from Operations is a sturdy measurement of cash generated by operating activities but it does not tell the entire story. It runs the risk of being transient as changes on the balance sheet can distort the long term cash generation potential of the operating activities. Once we look at the EBITDA growth for the main players, a different view comes to the surface.
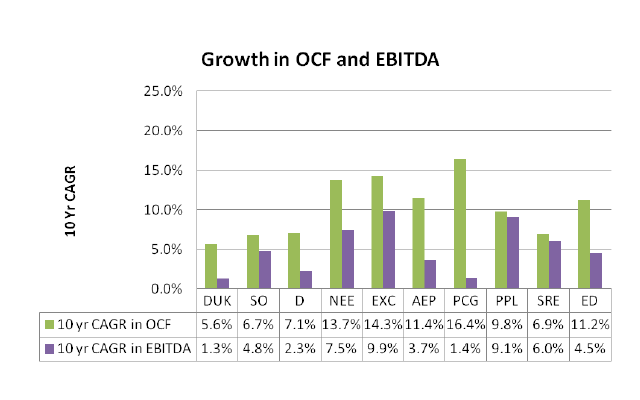
Growth in OCF has outpaced the growth in EBITDA for all of the top 10 utilities in the XLU. And in most cases, it has been by a material amount. It is important at this point to discuss briefly the delta between OCF and EBITDA. While EBITDA describes the cash profits collected by a firm, the OCF includes the changes that incur on the balance sheet in order to operate the company, i.e. the impact of changes to working capital. Over time, it should be expected that we see a convergence between the two rates for low growth companies.
What becomes obvious from figure 3 is that the top 10 utilities have been able to take cash off of their balance sheets at a rate faster than the cash they have generated through profits. This is not a bad outcome but it should not be considered sustainable over the long term. Therefore, to gain comfort in the future dividend stream, one needs to look at the growth in the excess capital generated by the firm. EBITDA is a good proxy for that (at least to start).
Figure 3: Growth in OCF and EBITDA (Bloomberg, CapitalIQ)
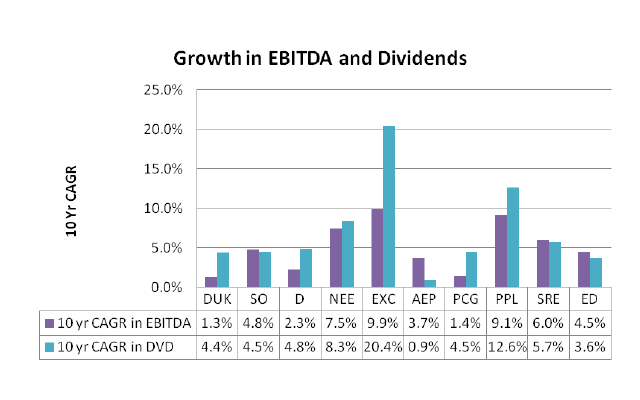
As we look at the growth in EBITDA (figure 4) for the top 10 utilities over the course of the last decade, more issues start to appear. In 6 out of the 10, dividend payments have grown faster than their profit generating ability.
Figure 4: Growth in EBITDA and Dividends (Bloomberg, CapitalIQ)
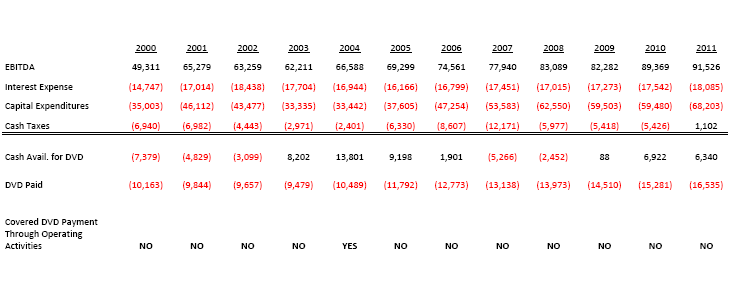
Looking at EBITDA is instructive but only half the story. In order to generate those profits (i.e. EBITDA), capital expenditures are required, debt must be serviced, and taxes must be paid. And as shown below, those three expenditures have needed all, and more, of the profits generated, leaving nothing for the equity holders. In only one year, has the group been able to fulfill its dividends in a natural, self-sustaining way.
Table 2: Historical Industry Cumulative Financials (Bloomberg, CapitalIQ)
Conclusion
All of this confirms the initial conclusion that the dividends of the utility sector are not sustainable. And that is with many factors being in their favor. Those include, but are not limited to, an open and favorable capital market, low rates, and a mix to low cost energy sources.
With the risks of competition (from IPP’s), the need for added infrastructure upgrades, ongoing need to invest in renewables, and the likelihood that the cost environment can only go in a less favorable direction (through natural gas prices and interest rates to name just two), the idea that the next 10 years will be better for the industry’s operations look way too optimistic.

